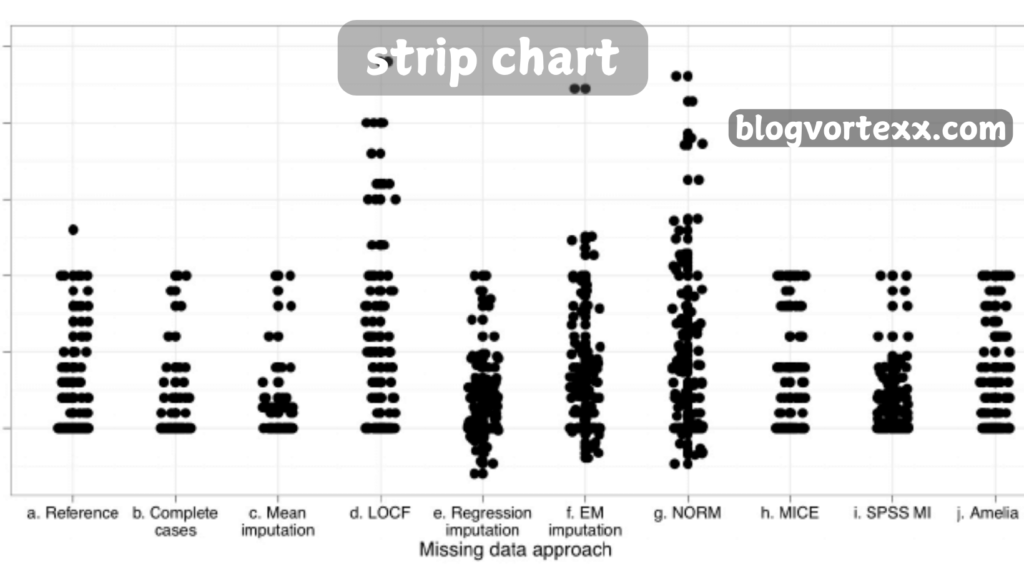
Introduction to Strip Chart
Strip chart, also known as strip plots or one-dimensional scatter plots, are essential tools for visualizing data over time. They represent individual data points along a single axis, making it easier to identify patterns, trends, and outliers in various fields such as science, engineering, and market research.
A strip chart is a graphical representation that displays data points as vertical lines or markers along a single axis. Each point corresponds to a specific observation or measurement. This format allows for the examination of data distribution and variability effectively.
Crucial Elements of Strip Charts
Strip charts are powerful visualization tools that provide a clear and intuitive way to analyze data. They are particularly useful for displaying data distributions along a single axis. Below are detailed explanations of three key features of strip charts: Data Visualization, Real-time Analysis, and Interactive Capabilities.
Data Visualization
Strip charts excel at presenting data in a straightforward manner, allowing users to quickly grasp the distribution and variability of data points.
- Clear Representation: Each data point is represented as a vertical line or marker, thus making it easy to see individual observations.
- Intuitive Layout: The linear arrangement along a single axis helps users understand the range and frequency of data points without confusion. Moreover, this layout minimizes the risk of misinterpretation.
- Highlighting Trends: By visualizing data points in this format, users can easily identify patterns, clusters, or trends that may exist within the dataset. As a result, they can make more informed decisions based on these insights.
- Comparison of Multiple Datasets: Strip charts can display multiple datasets on the same axis, which in turn facilitates direct comparisons between different groups or conditions. Consequently, users gain a clearer understanding of how these datasets relate to one another.
Real-time Analysis
Modern strip chart applications often support real-time data capturing and visualization, which enhances their utility in various fields.
- Instant Feedback: Users can observe data as it is collected, allowing for immediate insights into ongoing processes or experiments.
- Dynamic Updates: As new data points are captured, the strip chart updates automatically, providing a continuous view of the changing dataset.
- Enhanced Monitoring: In applications such as telecommunications or environmental monitoring, real-time analysis allows for quick detection of anomalies or trends that require immediate attention.
- Offline Analysis Capabilities: Many applications allow users to save captured data for later analysis, ensuring that valuable information is not lost and can be reviewed at any time.
Interactive Capabilities
Interactivity is a significant advantage of modern strip chart applications, allowing users to engage with the data more effectively.
- Zooming Functionality: Users can zoom in on specific areas of the chart to examine data points in greater detail. This feature is particularly useful for identifying subtle trends or outliers that may not be visible at a broader scale.
- Parameter Adjustments: Many applications allow users to adjust parameters such as time intervals or scaling options. This flexibility enables tailored views that suit specific analytical needs.
- User-Friendly Interfaces: Interactive strip charts often come with intuitive interfaces that make it easy for users to navigate through complex datasets without requiring extensive training.
- Data Filtering Options: Users can filter data points based on certain criteria, helping them focus on relevant information while ignoring noise or irrelevant data.
Pros of Using Strip Charts
Strip charts are powerful visualization tools that offer numerous benefits for data analysis. They provide unique insights into data distribution, trends, variability, and more. Below are detailed explanations of the key benefits of using strip charts.
Visualizing Data Distribution
Strip charts provide an immediate and intuitive view of how data points are spread across a range.
- Straightforward Representation: Each data point is displayed as a vertical line or marker along a single axis, allowing for easy interpretation of individual observations.
- Immediate Insights: Users can quickly assess the overall distribution of values, identifying where most data points cluster and how they are spread out.
- Comparison Across Groups: When multiple datasets are plotted on the same chart .Moreover, it becomes simple to compare their distributions side by side, revealing differences in patterns or behaviors.
Identifying Patterns and Trends
- Strip charts excel at helping users detect patterns or clusters within the data that may not be apparent in raw datasets. Furthermore, their visual clarity enhances the ability to identify trends over time or across different categories, thereby facilitating better decision-making.
- In addition, strip charts highlight relationships, allowing users to observe how different variables interact, which ultimately reveals correlations that might be missed in more complex visualizations. Consequently, these features make strip charts an invaluable tool for data analysis.
- Facilitating Hypothesis Testing: By visualizing trends, analysts can formulate hypotheses about the underlying causes of observed patterns. Further, guiding further investigation.
Assessing Variability
Strip charts effectively showcase the spread of data points, allowing users to understand variability and dispersion.
- Understanding Data Spread: The distance between data points illustrates how much variation exists within the dataset. Moreover, wider spread indicates greater variability, while a tighter grouping suggests consistency.
- Evaluating Consistency: By assessing variability, users can determine whether a process or measurement is stable over time, which is crucial in quality control and experimental settings.
- Informing Statistical Analysis: Insights gained from variability assessments can inform statistical tests and models, enhancing the robustness of conclusions drawn from the data.
Spotting Outliers
One of the significant advantages of strip charts is their ability to identify outliers or extreme values that deviate from the main data trend.
- Immediate Detection: Outliers are easily visible as they appear far from the main cluster of data points, allowing for quick identification and investigation.
- Impact on Analysis: Recognizing outliers is essential because they can significantly influence statistical analyses and interpretations. Understanding their cause can lead to valuable insights or necessary adjustments in methodology.
- Quality Control Applications: In manufacturing or service industries, spotting outliers can indicate defects. Anomalies that require immediate attention to maintain quality standards.
Examining Data Density
Strip charts reveal areas of higher or lower density within the dataset, highlighting where most observations occur.
- Density Visualization: By observing clusters of data points, users can identify regions with high concentrations of values versus those with sparse observations.
- Guiding Further Research: Areas with high density may warrant further investigation to understand underlying factors contributing to those concentrations.
- Resource Allocation: In business contexts, understanding data density can help allocate resources more effectively by focusing on areas with higher activity or demand.
Uses of Strip Charts in Practice
Strip charts are versatile tools widely used across various domains for visualizing data in a clear and effective manner. Below are some of the key practical applications of strip charts in different fields:
1. Scientific Experiments
- Trend Analysis: Strip charts are commonly used to visualize measurements from experiments, allowing researchers to analyze trends and patterns over time.
- Data Collection: They facilitate the collection and display of continuous data, such as temperature changes or reaction rates, which is crucial in experimental settings.
- Comparative Studies: Further, researchers can easily compare results from different experimental conditions by overlaying multiple strip charts.
2. Sensor Data Analysis
- Environmental Monitoring: Strip charts are useful for plotting sensor readings over time, such as temperature, humidity, or pollutant levels in environmental studies.
- Anomaly Detection: By visualizing sensor data continuously, users can quickly identify anomalies or deviations from expected patterns, prompting further investigation.
- Real-time Tracking: Many applications allow for real-time updates of sensor data, providing immediate insights into changing environmental conditions.
3. Quality Control
- Manufacturing Processes: In manufacturing, strip charts track quality metrics such as dimensions or weights to ensure products meet specifications.
- Variation Identification: They help identify variations in production processes, allowing for timely interventions to maintain quality standards.
- Statistical Process Control (SPC): Strip charts are often used in SPC to monitor process stability and performance over time.
4. Healthcare Monitoring
- Vital Signs Tracking: Healthcare professionals use strip charts to visualize patient vital signs (e.g., heart rate, blood pressure) over time, aiding in monitoring health trends.
- Lab Results Analysis: They can display laboratory test results continuously, helping clinicians identify significant changes in a patient’s condition.
- Telemedicine Applications: In remote healthcare settings, strip charts allow for the continuous monitoring of patients’ health metrics, enhancing patient care.
5. Sports Performance Analysis
- Athlete Metrics Visualization: Coaches and analysts use strip charts to visualize performance metrics such as running times or shot accuracy during training sessions and competitions.
- Progress Tracking: By comparing performance data over time, athletes can track improvements and identify areas needing attention.
- Injury Prevention: Analyzing performance trends helps in identifying potential injury risks based on training loads and physical responses.
6. Market Research
- Survey Responses Visualization: Strip charts are effective for plotting survey responses or customer ratings to understand sentiment distribution among customers.
- Consumer Behavior Analysis: They help marketers visualize trends in consumer preferences and behaviors over time, facilitating better decision-making.
- Identifying Outliers: By displaying individual responses clearly moreover, strip charts can highlight outliers that may indicate unique customer opinions or experiences.
7. Financial Data Analysis
- Stock Price Tracking: Financial analysts use strip charts to track stock prices and trading volumes over time, observing market trends or unusual activities.
- Risk Assessment: By visualizing historical financial data, analysts can assess risk levels associated with investments or trading strategies.
- Market Anomalies Detection: Strip charts help detect sudden changes in market behavior that may signal investment opportunities or risks.
Conclusion
In conclusion, strip charts are invaluable tools for visualizing data across various fields, offering clarity and insight into complex datasets. Their ability to display individual observations along a single axis makes them particularly effective for small to moderate-sized datasets. Allowing users to quickly identify trends, patterns, and outliers. The applications of strip charts span scientific experiments, sensor data analysis, quality control, healthcare monitoring, sports performance analysis, market research, and financial data analysis.
Also read: Zhuoxin Data Technology: Leading Data Solutions
FAQs
Are there any limitations to strip charts?
Yes, strip charts can become cluttered with larger datasets, making interpretation challenging. They may also be less effective for comparing multiple groups simultaneously due to overlapping points.
In what fields are strip charts commonly used?
Strip charts are used in various fields, including scientific research, environmental monitoring, quality control in manufacturing, healthcare monitoring, sports performance analysis, market research, and financial data analysis.
How do strip charts help in quality control?
In manufacturing, strip charts track quality metrics to identify variations or outliers in production processes. Helping maintain product standards and improve overall quality.
Can strip charts be used for real-time data visualization?
Yes, many modern applications support real-time data capturing and visualization using strip charts, making them useful for monitoring ongoing processes such as environmental conditions or telecommunications signaling.
What types of data are best suited for strip charts?
Strip charts work best with continuous numerical data where individual observations can be plotted along an axis. Making them suitable for measurements like temperature, pressure, or stock prices.
How do I interpret a strip chart?


